2. Definitions: Metrics
What every number on Giftnote's Analytics pages means, report by report, and where to find the metrics you used before September 2026.
Written By Giftnote Admin
Last updated 4 days ago
What each number on Giftnote's Analytics pages means, and where to find the numbers you used before September 2026. To open Analytics, click Analytics in the Giftnote menu, or Open analytics on Home.
Overview page
The main Analytics page is called Overview. It has no date range: it tells the story since you installed Giftnote, then shows the last 30 days.
- Since you installed Giftnote: your gift sales in total, with a chart of the last 12 months, and six figures:
- Gifts sent, and what share went to unique recipients.
- Gross sales: the sales value of your gifts, including refunds and cancellations.
- Converted: the share of recipients who later bought something, and how long they took on average.
- Return on Giftnote: what converted recipients bought, divided by what Giftnote cost you. 4.0× means they spent four times what you paid.
- Leads: recipients whose contact details you received through a gift, split into new and repeat.
- First purchases: conversions that were the recipient's first order with you.
- The last 30 days: Gifts, Gift sales, Conversions and Average gift, each compared with the 30 days before.
- Reports: a card for each report with its key figure. Click a card to open the report.
Around big dates such as Black Friday – Cyber Monday, a banner links to that occasion's report in Moments.
Dedicated pages
Each report has its own date range at the top (for example Last 7 days).
- Performance: Gifts, Gift sales, Spend, Conversions and Average gift for your date range, compared with the period before. Select a figure to chart it over the range. By gift type splits your gifts into gift orders, gift cards and Multi Gifts. Where gifts started and How gifts were sent (delivery method and medium) show how your gifts came in and went out.
- Moments: your gifting month by month and around key dates such as Black Friday – Cyber Monday. Each key date gets its own report of what sold and when recipients came back.
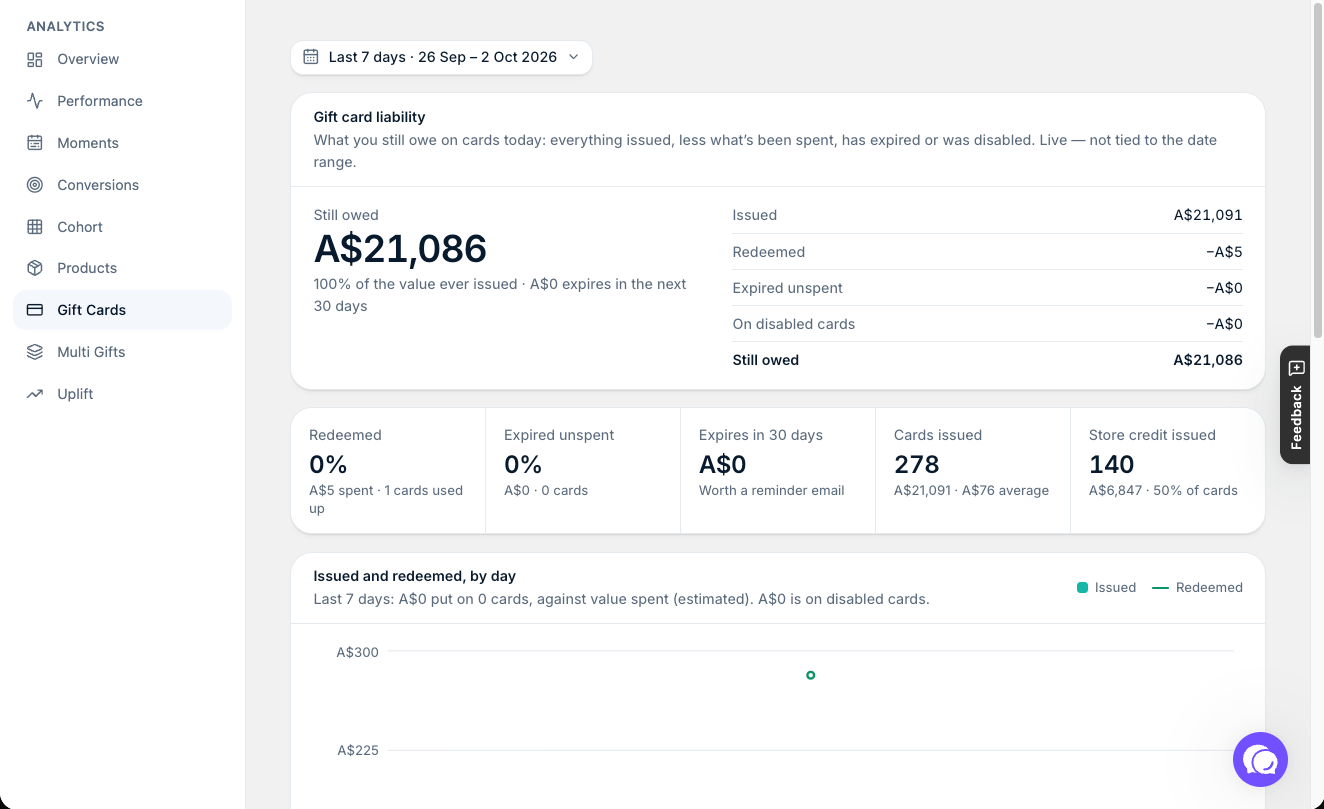
- Gift cards: Gift card liability, headed by Still owed (unspent balance you still owe customers). It shows what was Issued, then takes off what was Redeemed, Expired unspent and On disabled cards. Below that: Expires in 30 days, Cards issued with the average card value, Store credit issued, Issued and spent over time, When the balance expires (next 30 days, 31–60 days, 61–90 days, later, or no expiry) and How fast cards get spent. The liability figures are live balances, so they ignore the date range.
- Multi Gifts: Multi Gifts in range, Submitted, Completed and Sales in range for your date range, plus Recipients in range, Shipping and tax, and What Multi Gifts carried (products, shipping, tax and message surcharge).
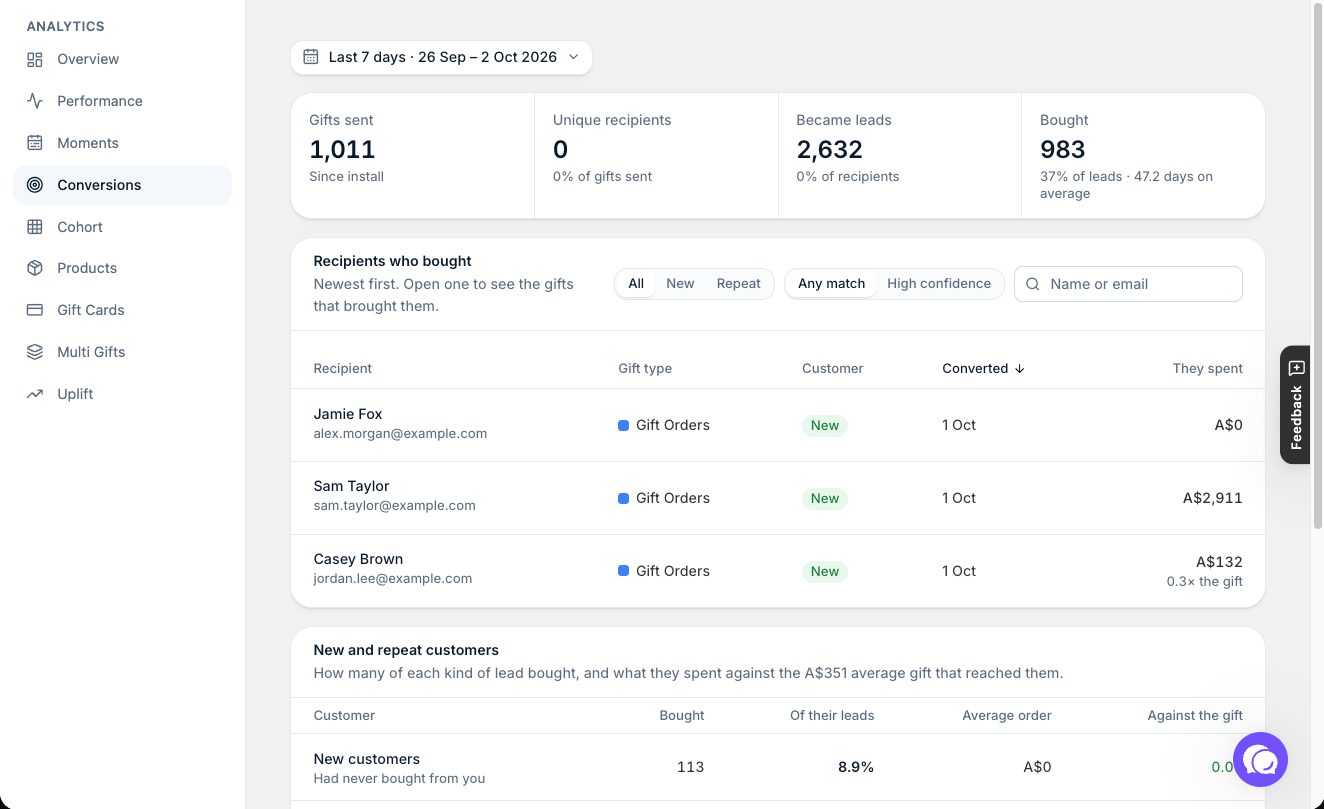
- Conversions: recipients who later became paying customers. Shows Gifts sent, Unique recipients, Became leads and Bought (with the average days from gift to purchase), then Recipients who bought, newest first. You can show new or repeat customers only, and open a recipient to see the gifts that brought them.
- Cohort: how the gifts from each month keep turning into sales in the months after.
- Uplift: how much more your gift orders are worth than regular orders. It also has Gift Audit, which checks past orders for gifts that didn't go through Giftnote.
- Products: Products gifted, Items gifted, Gifted sales and Top five carry (the share of gifted sales from your top five products), then a table of your gifted products with their Sales, Gifts, Spend and Conversions. Gift card products aren't included.
Where the old metrics went
If you used Giftnote before September 2026, here's where to find each number now.
- Gifted revenue (revenue from orders with a gift) → Gifting sales on Home and Gift sales on Performance.
- Gifted orders and Giftnotes sent → Gifts (Performance) and Gifts sent (Home).
- Gifted AOV → Uplift, which compares gift orders with your regular orders.
- Messages and gift cards breakdown, Message revenue and Vouchers revenue → By gift type on Performance (gift orders, gift cards, Multi Gifts).
- New conversions (a recipient who later bought) → Bought on Conversions. Filter Recipients who bought to new customers.
- Delivery methods chart → How gifts were sent (delivery method and medium) and Where gifts started on Performance.
- Monthly view → the date range on each report, and Cohort for month-by-month results.
- Top products → Products.
- Lifetime analytics → the Overview page.
New purchasers, New recipients and Existing recipients don't appear as labels on the current Analytics pages. For the old Running total chart, use the Running total view on Cohort.
Cohort terms
- Same, +1, +2…: the gift month, then months after it.
- Conversion rate: conversions ÷ leads.
- Conversion sales: what converted recipients spent.
- Cost per customer: spend ÷ conversions.
- Return on spend: return per dollar spent (conversion sales ÷ spend).
- Running total: adds each month to the ones before it. Pick Each month to see each month on its own.
Use Heat to color the grid by Conversions, Conversion rate, Conversion sales, Return on spend or Cost per customer, and show All, New or Repeat customers.
Related articles
Was this helpful?
Still need help? Share an idea